
written by Magdalena Halbgewachs
Sentinel-5P is a satellite that is operating within ESA’s Copernicus program since 2017. The goal of the mission is a very dense scheduled operational monitoring of the atmosphere. Using the TROPOMI instrument on board, various parameters are measured, such as tropospheric pollutants, greenhouse gases, aerosols, and cloud cover. NO2 concentrations are also provided as a separate product, which can be downloaded as NetCDF.
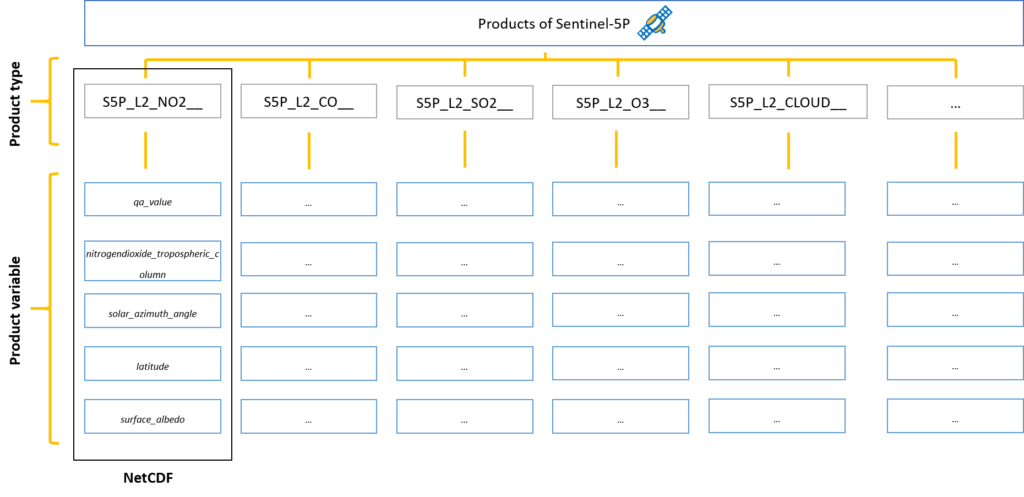
Figure 1: Data structure of the Sentinel 5P products
More information about this product can be found in the ESA user manual.
R script
With the help of the R package GetSpatialData various satellite data available on the Copernicus Open Access Hub can be downloaded automatically. Conditions like recording period, satellite, product type and area of interest can be defined. NO2 data is stored in the Sentinel-5P product type L2__NO2___, therefore only this data is of interest and should be downloaded for the desired period.
The subsequently downloaded NetCDF files contain several variables, such as longitude and latitude, different viewing angels and various nitrogen dioxide related variables. Product variable 6 (nitrogendioxide_tropospheric_column) displays the NO2 concentration in the troposphere, which is used for the following analysis.
Using the S5Processor package, this variable can be queried and saved as GeoTiff. In addition, cloud masking is applied to prevent outliers. Product variable qa_value indicates the error probability of the measured values (e.g. due to cloud cover or snow). By blending the two variables and the resulting elimination of errors (qa_value < 0.5 = NoData) a corrected nitrogen dioxide layer is obtained (unit molecules/cm²).
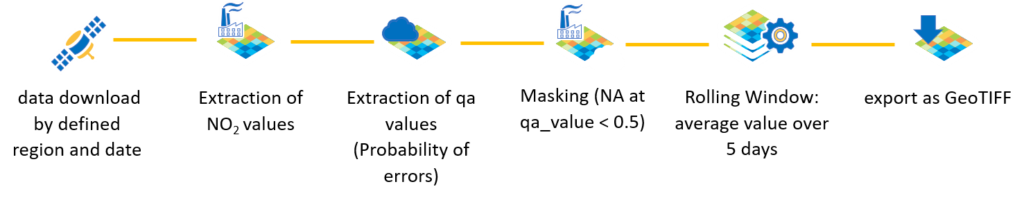
Figure 2: Workflow R script
How are the result layers supposed to be interpreted?
The script focuses on the technology used and not on the scientific interpretation of the results. Nevertheless:
- Values provide information about NO2 concentrations in the troposphere (up to 15 km above the earth’s surface), but not at a specific location near the ground (e.g. a busy road)
- NO2 concentrations are based on different influencing factors: Winds influence the airflow of NO2 from or in neighboring countries; cloud cover falsifies measured values and must be masked; low temperatures prevent the air masses from rising and thus also the rise of NO2; thunderstorms: lightning as a source of nitrogen oxides
- Averaging over a certain period bypasses NoData values and eliminates meteorological effects that occur selectively
After all data has been transformed and edited, the workflow is continued in ArcGIS Pro. ArcGIS Pro makes it easy to create an automated workflow within the ModelBuilder that performs spatial analysis using the appropriate geoprocessing tools.
In this case a mosaic dataset is created and enriched daily with the newly exported NO2 GeoTiff files. With latest addition to ArcGIS Pro (2.5 and later) this Mosaic can be declared a Multidimensional dataset and thus allow the Multidimensional tools (aggregation, change detection, trending, etc.) to be applied.
Once the scripts are set up, they can be run automatically every day, for example, using the Windows Task Scheduler.
The R script can be downloaded on GitHub.
A detailed StoryMap of myself with illustrations and the Sentinel-5P image service can be found here (only in German).
The whole animation starting in March 2020 is available as Web Application.