
For our final project in the course “MB2 – Introduction to Programming and Geostatistics” held by
Dr. Martin Wegmann the students were encouraged to explore the possibilities for analyzing and
working with remote sensing data in R. In this context I created a package called “superClassAnalysis”
that includes several functions which add further methods for data analysis to the “superClass()”
command of the “RStoolbox” built by Benjamin Leutner. The aim of the package is to find the best
presets in form of resolution, number of sample pixels, polygons and number of bands in order to
achieve highest classification accuracies.
The package can be downloaded in installed via GitHub:
[code language=”R”]devtools::install_github("MBalthasar/superClassAnalysis")[/code]
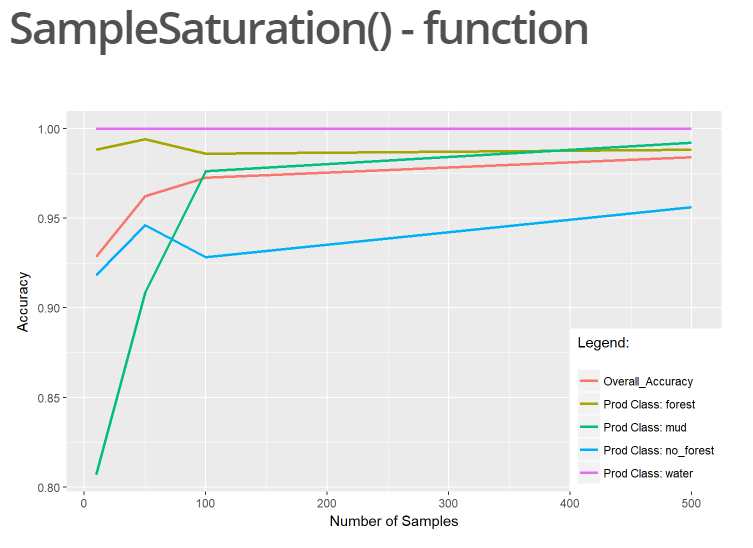
As of right now the package consists of seven functions, one of them being the “SampleSaturation()”
function. It enables a quick analysis of the minimum number of sample pixels required for each class
in order to receive best results in a supervised classification. The user has the ability to automatically
plot the result in form of a table or a ggplot which shows the overall accuracy, as well as either the
user’s or producer’s accuracy for each class depending on the user’s preference.
[code language=”R”]
x1 <- SampleSaturation(img = img, model = ‘rf’, trainData = training_data,
valData = validation_data, nSamples = c(10, 50, 100, 500),
classes = training_data$class_name,
responseCol = "class_name", prodAcc = TRUE,
overall = TRUE, plot_graph = TRUE)
[/code]
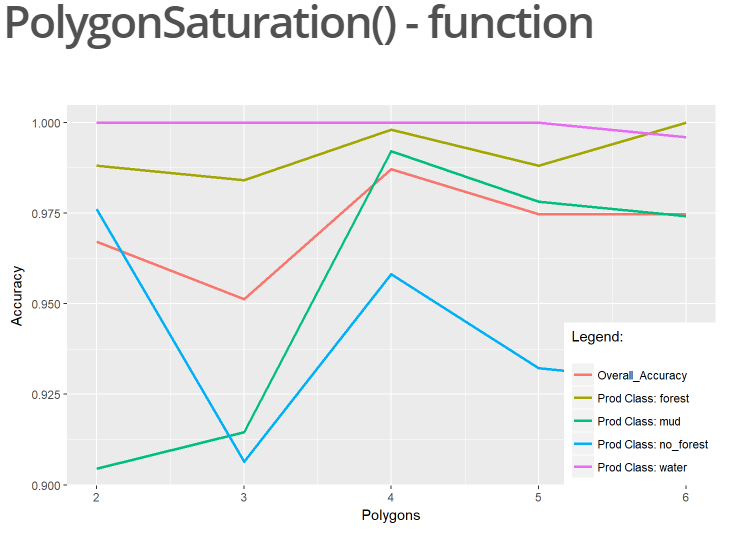
Another function included in the package is the “PolygonSaturation()” function. The purpose of this function is to analyze the impact of each polygon on the classification accuracy and aids for identifying potentially erroneous or generally bad polygons. In order to achieve that, a supervised classification loop will be executed starting with two polygons per class. After each run, one additional polygon per class is being added and the accuracy results for each classification is again displayed in form of a ggplot. In this example when looking at the class “no_forest” the producer’s accuracy increases with the fourth polygon, while the fifth polygon results in a decrease of the producer’s accuracy for that class.
[code language=”R”]
x2 <- PolygonSaturation(img = img, model = ‘rf’, trainData = training_data,
valData = validation_data, nSamples = 100,
classes = training_data$class_name,
responseCol = "class_name", prodAcc = TRUE,
overall = TRUE, plot_graph = TRUE)
[/code]
Other functions included in the package are e.g. the “ResolutionSaturation()” function, which analyzes the impact of spatial resolution of remote sensing data on classification processes by resampling the raster file to different resolutions according to a given vector. Again a classification loop will run with the different resolutions and the result is automatically visualized.
All functions are written in a way so that they automatically adjust to the given dataset, independent of its size, number of classes or the class names.
Reporting from the Students’ Board
Marius Philipp