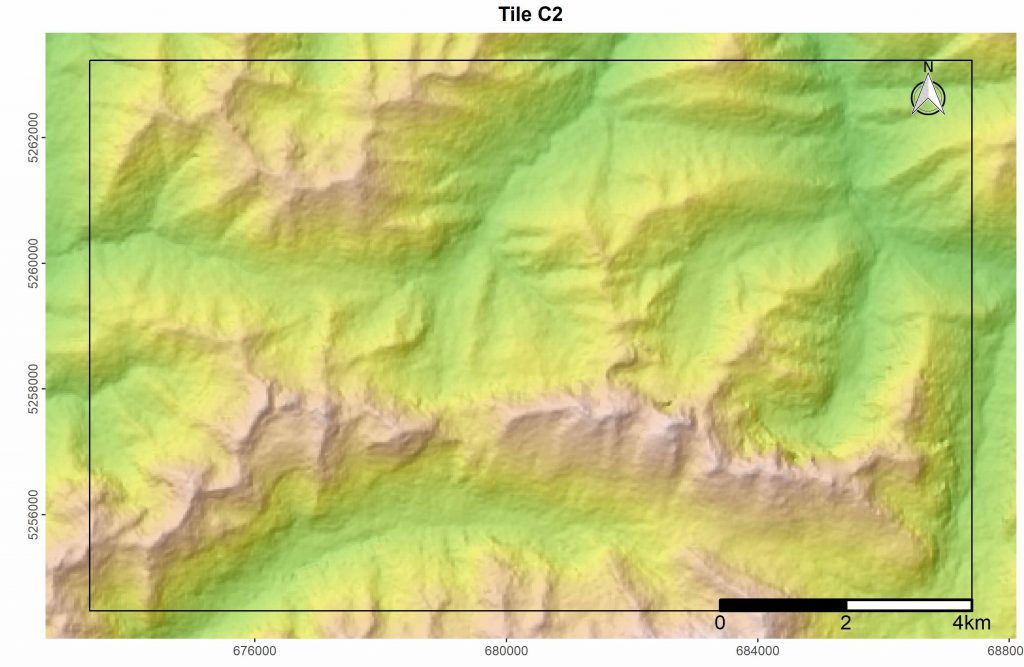
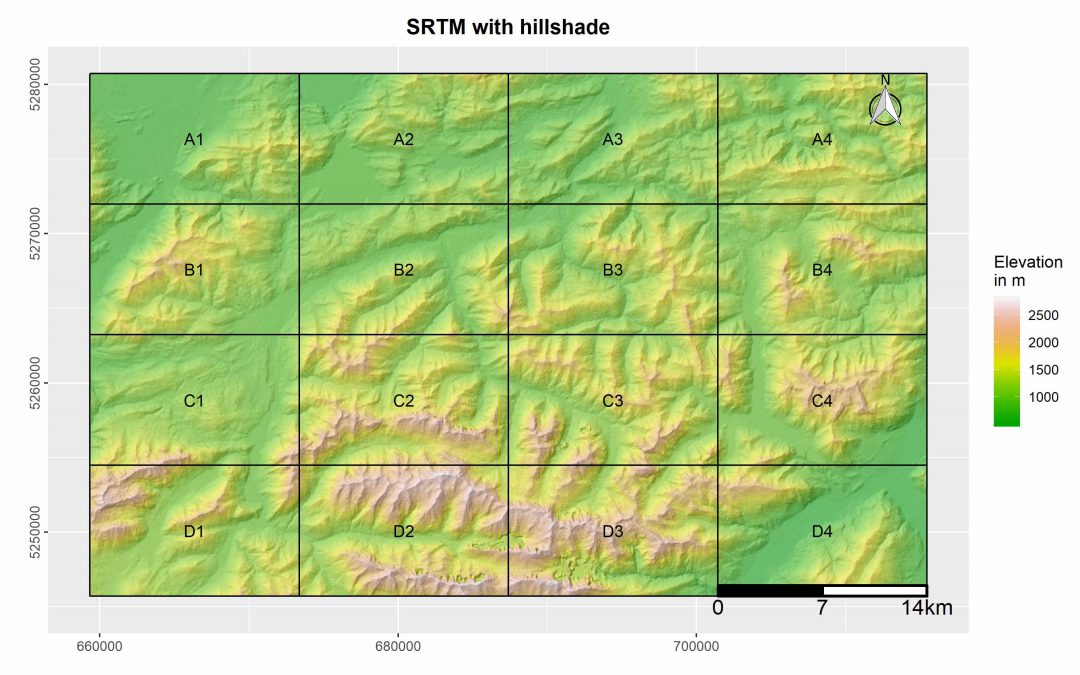
This R package was designed by EAGLE student Marius Philipp for the automatized generation of map booklet pdfs for user defined ggplots. The package contains currently two functions, one of which creates a fishnet polygon from the extent of the user input data. The second function uses this fishnet polygon in combination with a user ggplot for the creation of a map booklet, including an overview map (see above), as well as a submap for each tile (see below).
Here an examplary script:
[code language=”R”]# Install package from github
library(devtools)
devtools::install_github("MBalthasar/MapBooklet")
library(MapBooklet)
# Load required packages
library(sp)
library(raster)
library(ggplot2)
library(ggsn)
library(geosphere)
library(RStoolbox)
library(pdftools)
library(magick)
# Load sample srtm and hillshade
my_srtm <- raster::brick(system.file(package = "MapBooklet",
"extdata", "srtm_sample.tif"))
my_hill <- raster::brick(system.file(package = "MapBooklet",
"extdata", "hillshade_sample.tif"))
# Use ggR to plot raster files
my_plot <- ggR(my_hill, # Add hillshade
# maxpixels = my_hill@ncols*my_hill@nrows # Use full resolution
) +
ggtitle("SRTM with hillshade") + # Add title
ggR(my_srtm, geom_raster = TRUE, ggLayer = TRUE, alpha = 0.5, # Add srtm with alpha = 0.5
# maxpixels = my_srtm@ncols*my_srtm@nrows # Use full resolution
) +
scale_fill_gradientn(colours = terrain.colors(100), # Choose colors for srtm
name = "Elevation\nin m") + # Choose name for legend
theme(plot.title = element_text(hjust = 0.5, face="bold", size=14), # Adjust title
axis.text.y = element_text(angle = 90, hjust = 0.5)) + # Vertical y axis labels
xlab("") + # Remove x lab
ylab("") # Remove y lab
# Plot map
my_plot
# Create fishnet polygon from raster extent
my_extent <- methods::as(raster::extent(my_srtm), ‘SpatialPolygons’)
proj4string(my_extent) <- sp::CRS(as.character(raster::crs(my_srtm)))
my_fishnet <- FishnetFunction(my_poly = my_extent, extent_only = TRUE, diff_factor = 4)
# Execute with all parameters defined.
# In orer to have a landscape DinA4 format, multiply the width by 1.414286.
my_booklet <- BookletMaker(user_ggplot = my_plot,
user_fishnet = my_fishnet,
fishnet_col = "black",
user_width = 7 * 1.414286,
user_height = 7,
user_pointsize = NULL,
out_dir = "./",
user_buffer = 0,
add_scale = TRUE,
add_north = TRUE)[/code]