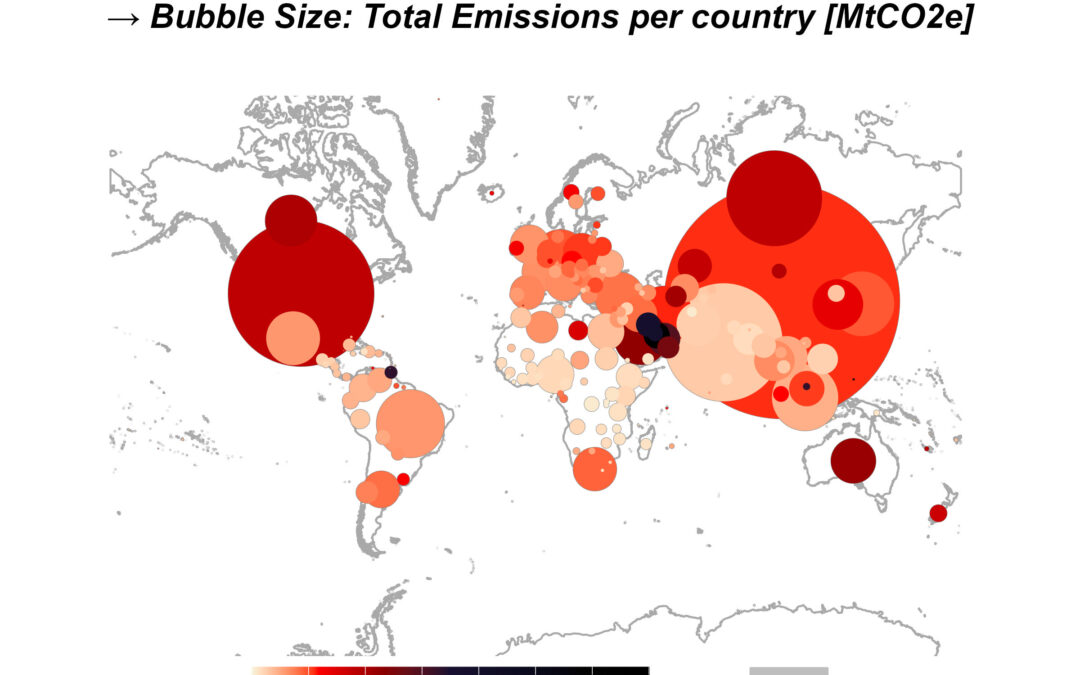
For our “Programming & Statistics for Remote Sensing and GIS” course we have developed an R package to efficiently merge (geo)dataframes, identify, and move “spatial outliers” in geodata, create geographic plots, bubbleplots, and the animation between these plots.
You can access it via https://github.com/Geo-99/bubblegam
We would be happy if you try it out and perhaps find it useful. Also, feel free to send us feedback or create a github issue if something is not working for you. Thanks! 🙂