
Why can we detect trucks using Sentinel-2 data?
Earth observation is delivering significant insights that help us to understand consequences the drastic crisis has on the environment, the people and the economy. I would like to tell you about how I could contribute something to the earth observation crisis response. In the context of the COVID-19 Custom Script Contest organized by ESA and Euro Data Cube I developed a Sentinel-2 truck detection method. It relies on an effect that spectrally exposes moving objects of a certain size in Sentinel-2 data. This effect is caused by the layout of its Multispectral Instrument (MSI). I will give you an explanation of the effect, the method development and my experience upscaling the detection to whole EU extent for integration into the ESA RACE dashboard.
How Sentinel-2 sees moving trucks
Sentinel-2 carries a push-broom sensor. In order to cover the 290 km field of view (FOV), 12 detectors are arranged in two parallel arrays on a focal plane. Those detectors acquiring the visual (VIS) and near infrared (NIR) cover ten spectral bands each. This configuration causes two effects:
- inter-detector,
- inter-band parallax angles.
In other words, the MSI is squinting slightly. Considering a single pixel, the parallax angles result in a band-specific viewing geometry of this pixel. MSI sees it at slightly different times, depending on the band. Normally, as remote sensing analysts we do not have to worry a lot about viewing geometry effects, since most of these are corrected during the ground processing to level 1 data. The multispectral registration of Sentinel-2 data is better than 0.3 pixels. However, this correction cannot compensate two variables if they are unknown for an object: its altitude and its movement. For instance, if an airplane is flying over Würzburg in Germany, the ground processing assumes the altitude of Würzburg (approx. 180 m) as provided by a digital elevation model (DEM). Moreover, the airplane is moving, whereas the ground processing assumes static objects. As the airplane does, a truck is also traveling, however on the DEM altitude. During the small sensing offset, it keeps moving. The offset between B02 (blue) and B03 (green) is 0.52 seconds for instance and another half a second to B04 (red). Therefore, the truck is captured once per band at different positions (Fig. 1).

Fig. 1: Moving object in Sentinel-2 data
Resources:
ESA 2020 – Multi Spectral Instrument (MSI) Overview
Gascon et al. 2017 – Copernicus Sentinel-2A Calibration and Products Validation Status
Gatti et al. 2015 – Sentinel-2 Products Specification Document
How to detect trucks
In April 2020, during the (hopefully first and only) peak of the COVID-19 pandemic in Germany my plans for this semester (going abroad for the thesis) got cancelled. I read about the COVID-19 Custom Script Contest and considered it as a great opportunity to explore new methods, tools and also to contribute to the earth observation response to the crisis. After having experimented for several days, I achieved promising results with the truck detection using Sentinel-2 data. Key was not to target the whole ‘rainbow’ truck object, instead just the blue part as a marker as superior blue reflectance is rare. The detection only relies on simple reflectance band math (see code on GitHub). Results around Rotterdam and in the Ruhr area suggest interesting dynamics of truck counts compared by weekday between before and during the pandemic. A few weeks after submission I was happy to see that my truck detection became the overall winner of the Custom Script Contest. One main reason might have been that truck detection with Sentinel-2 had not been done before.
Upscaling
As response to the COVID crisis ESA and European Commission launched the Rapid Action on Coronavirus and EO (RACE) platform in the beginning of June. In the dashboard people can explore several EO-derived indicators that depict the impact of the crisis. Among other winning ideas of the custom script contest I was offered to upscale my method and eventually integrate it into the RACE dashboard.
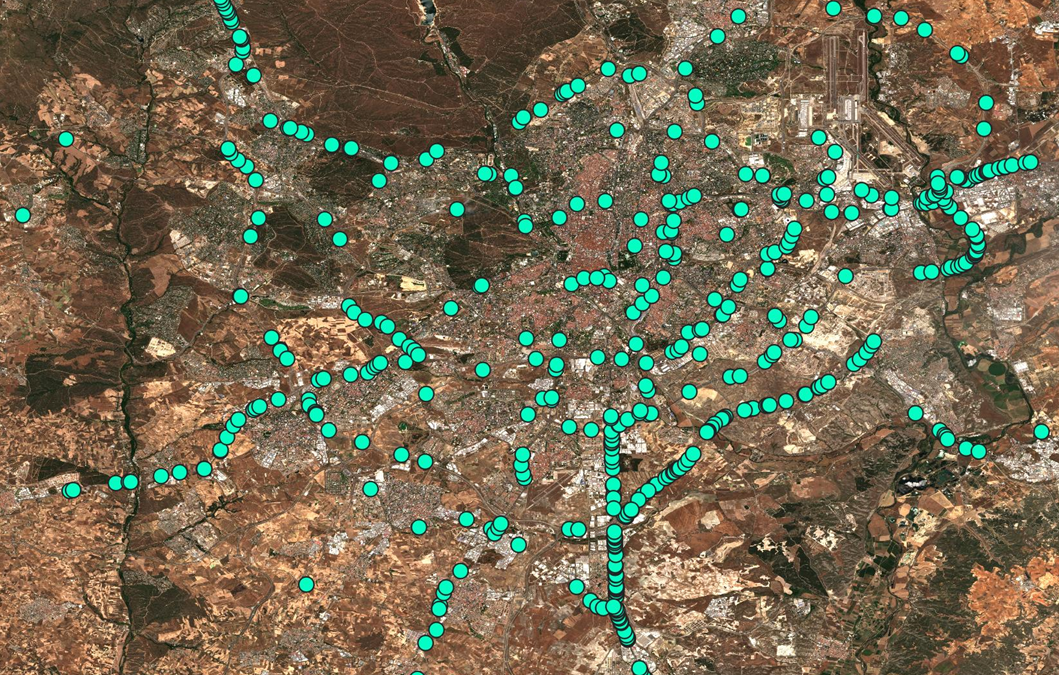
I started the upscaling process by first improving the detection method itself. This included enhancing the cloud masking, constraining the detection to buffered Open Street Maps (OSM) roads and adding a spatial filter. The latter limits the detected pixels to one per truck. In Fig. 2 you see examples of detections in southern France using the enhanced method.

Fig.2: Truck detection examples in southern France (contains modified Sentinel-2 L2A data processed by Euro Data Cube)
This enhanced detection method had to be embedded into a processing chain for several time periods and covering the whole EU. The main challenges were to implement a senseful temporal aggregation with low interference of weekday differences and with enough valid observations on the whole EU extent. Furthermore, all this had to be processed until due in mid of July. I implemented the processing chain in an EOX-hosted JupyterLab on Euro Data Cube accessing data from Sentinel Hub through xcube. After processing billions of pixels, I submitted the processing results, the computed indicators, detailed method description, validation result and a COVID-related analysis to ESA. Currently (end of July 2020), the results of all upscaling contest participants are being evaluated and prepared for integration into the RACE dashboard.
Wrap
It was good to contribute at least something small to coping with the pandemic. In general, the earth observation community is impressively showing during this pandemic how much we need satellites capturing earth from space. What is particularly fascinating about it: The analysis based on this data is not always just scientifically interesting or relevant. Observing earth from space is also personal. For me the crisis has demonstrated this in an extraordinarily clear and concrete way. For instance, the rapid decrease of NO2 emissions with reduced anthropogenic activity, that shows our daily impact on the planet. We must face the question to what type of ‘normal’ we would like to get back after the crisis. Earth observation may support answering this scientifically – and personally.